Big Data Analysis
Big Data Acquisition
- EIDS equipment and systems acquire orders of magnitude more new data than current testing.
- EIDS captures, interprets, and analyzes microbial data at a scale unparalleled within the industry.
Data Analytics Portal
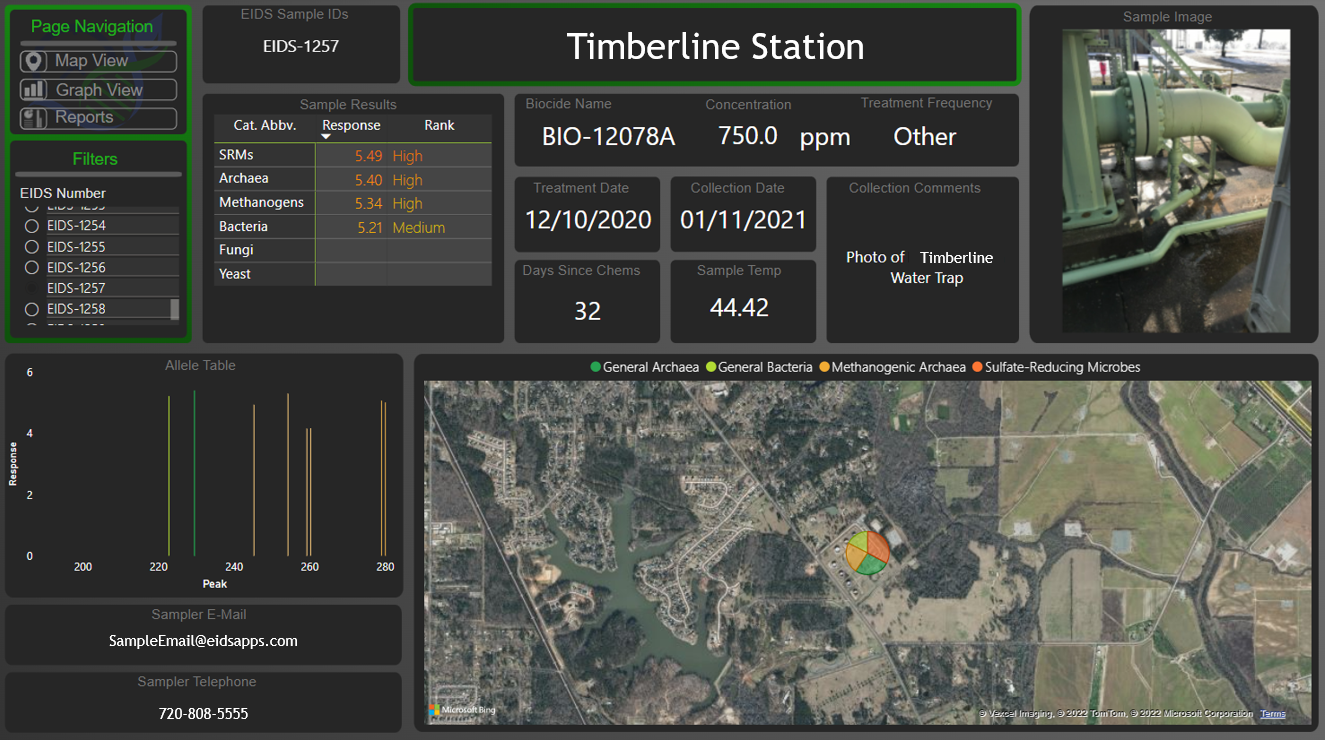
- EIDS Data Analytics Portal permits all data to be sorted, visualized, and compared.


Field Asset Monitoring
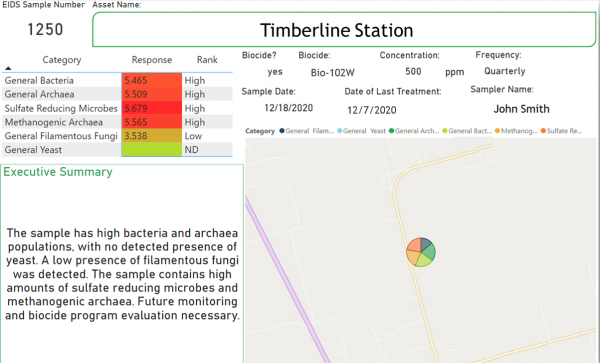
- Individual reports are produced for each sample.
- Sampling information is combined with Rapid-DNA results.
- Asset level data allows technicians to take immediate action to make real-time treatment decisions.
Area Management
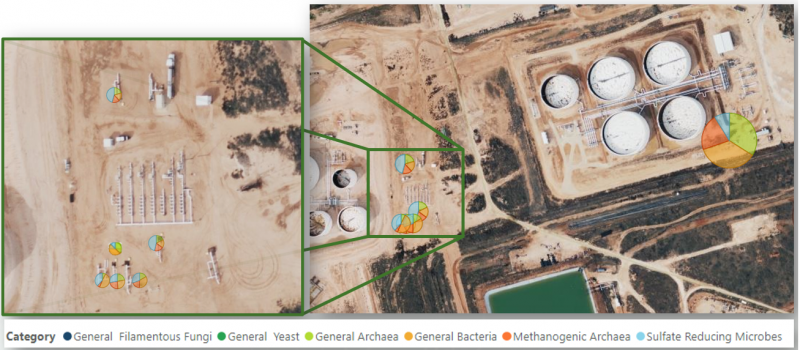
- View precise individual sampling points.
- View and understand the results gathered from assets within a specific area to optimize treatment plans and reduce both corrosion and costs.


Strategic Management
- Unique sorting and graphics provide deeper insights.
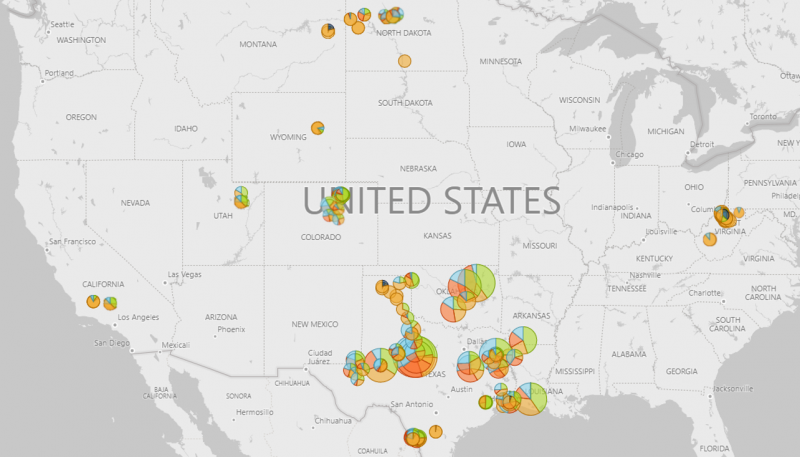
- Colors indicate microbial type.
- Diameter indicates approximate microbial content.
- Sort and display by any or all sample attributes.
- Visualize and compare all categories.
- Allows review of entire infrastructure.
- Identifies trends and tracks improvements in real time.
- Focus on most high-risk assets.
Big Data Acquisition
- EIDS equipment and systems acquire orders of magnitude more new data than current testing.
- EIDS captures, interprets, and analyzes microbial data at a scale unparalleled within the industry.
Data Analytics Portal
- EIDS Data Analytics Portal permits all data to be sorted, visualized, and compared.

Field Asset Monitoring
- Individual reports are produced for each sample.
- Sampling information is combined with Rapid-DNA results.
- Asset level data allows technicians to take immediate action to make real-time treatment decisions.

Area Management
- View precise individual sampling points.
- View and understand the results gathered from assets within a specific area to optimize treatment plans and reduce both corrosion and costs.

Strategic Management
- Unique sorting and graphics provide deeper insights.
- Colors indicate microbial type.
- Diameter indicates approximate microbial content.
- Sort and display by any or all sample attributes.
- Visualize and compare all categories.
- Allows review of entire infrastructure.
- Identifies trends and tracks improvements in real time.
- Focus on most high-risk assets.
